
Tracking spending
Published:
In this post, I mentioned that Fidelity Full View provides account syncing for Fidelity customers. Dividing spending into categories, it also presents a pie chart of spending. The picture below is my own example; I erased the specific amounts and kept only the percentages. In general, to save money, it is best to focus on spending categories with large shares, which in my case are home, children, food, travel, etc.
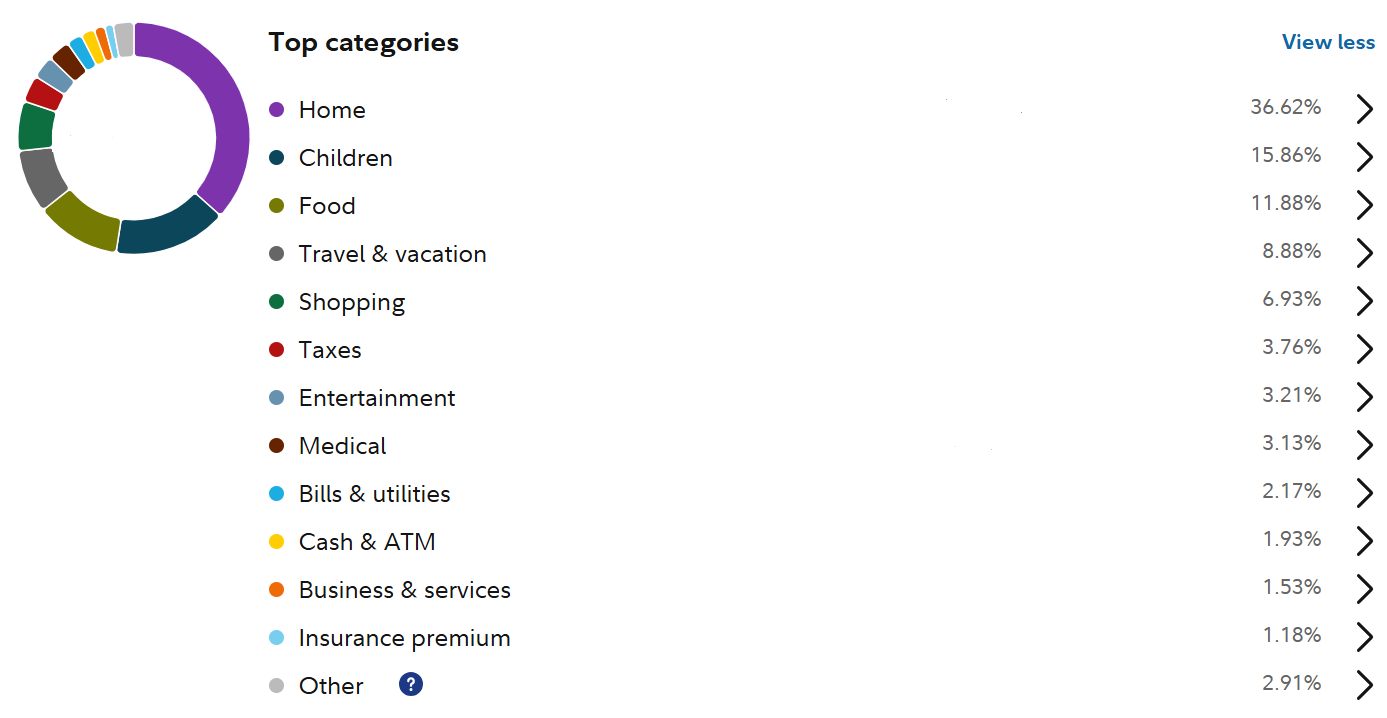
One caveat with this pie chart is that some of the items are missing due to syncing issues. For example, this year I put large federal tax payments on my Capital One Quicksilver Card, but for some reason, all transactions before October 2025 are missing, and hence tax payments are underestimated. However, upon inspection, other accounts appear to be synced correctly, so it is not a major problem.
Another caveat, which applies to any online syncing services, is that only disposable income is observable, and pre-tax income is missing. Consequently, even though I pay a lot of tax, it is entirely missing from the pie chart (unless I made additional payments). Similarly, if you click the category “Home”, it will show a subcategory “Mortgage”, but this is the total mortgage payment, and it does not break down into principal, interest, and property tax.
I still think Fidelity Full View is quite useful for understanding my financial situation with very little cost, but unlike when I was keeping track of expenses manually, there are limitations.