Publications, Citations, Position, and Compensation of Economics Professors
Published in Econ Journal Watch, 2019
I got tenure at UCSD in 2019, but as the date of tenure review approached, I got interested in how much raise I should expect. So in 2017, I started checking the compensation at University of California to get an idea. I found the dataset very interesting, as it is error-free. In those days I sometimes talked to Yifei, who was a Ph.D. student interested in applied stuff, so we started gathering data on salary, publications, etc., of our colleagues. We then ran predictive regressions. I was careful not to post a working paper because I did not want to undermine my tenure review, but several esteemed econometricians such as Brendan and Yixiao found the results interesting and advised us on model specification. After I got tenure, we submitted this paper to Econ Journal Watch, which is one of my favorite journals.
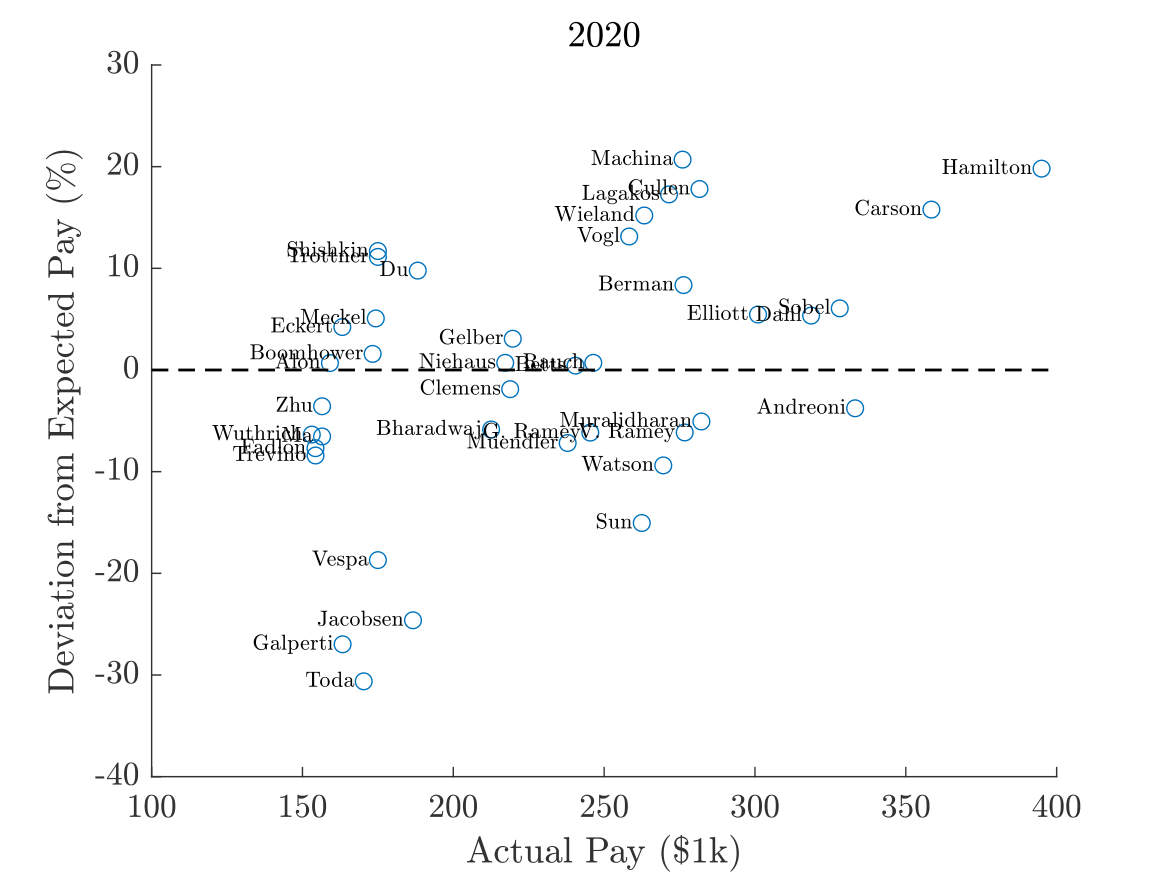
In 2020, when preparing my two-year review file, I updated the dataset to present evidence to the department chair and administration that I was significantly underpaid. In the picture below, the horizontal axis shows the actual 9-month salary paid during the calendar year, and the vertical axis shows the percentage deviation of actual salary from expected salary (essentially the OLS residual) obtained from a predictive regression based on the publication record and other variables.
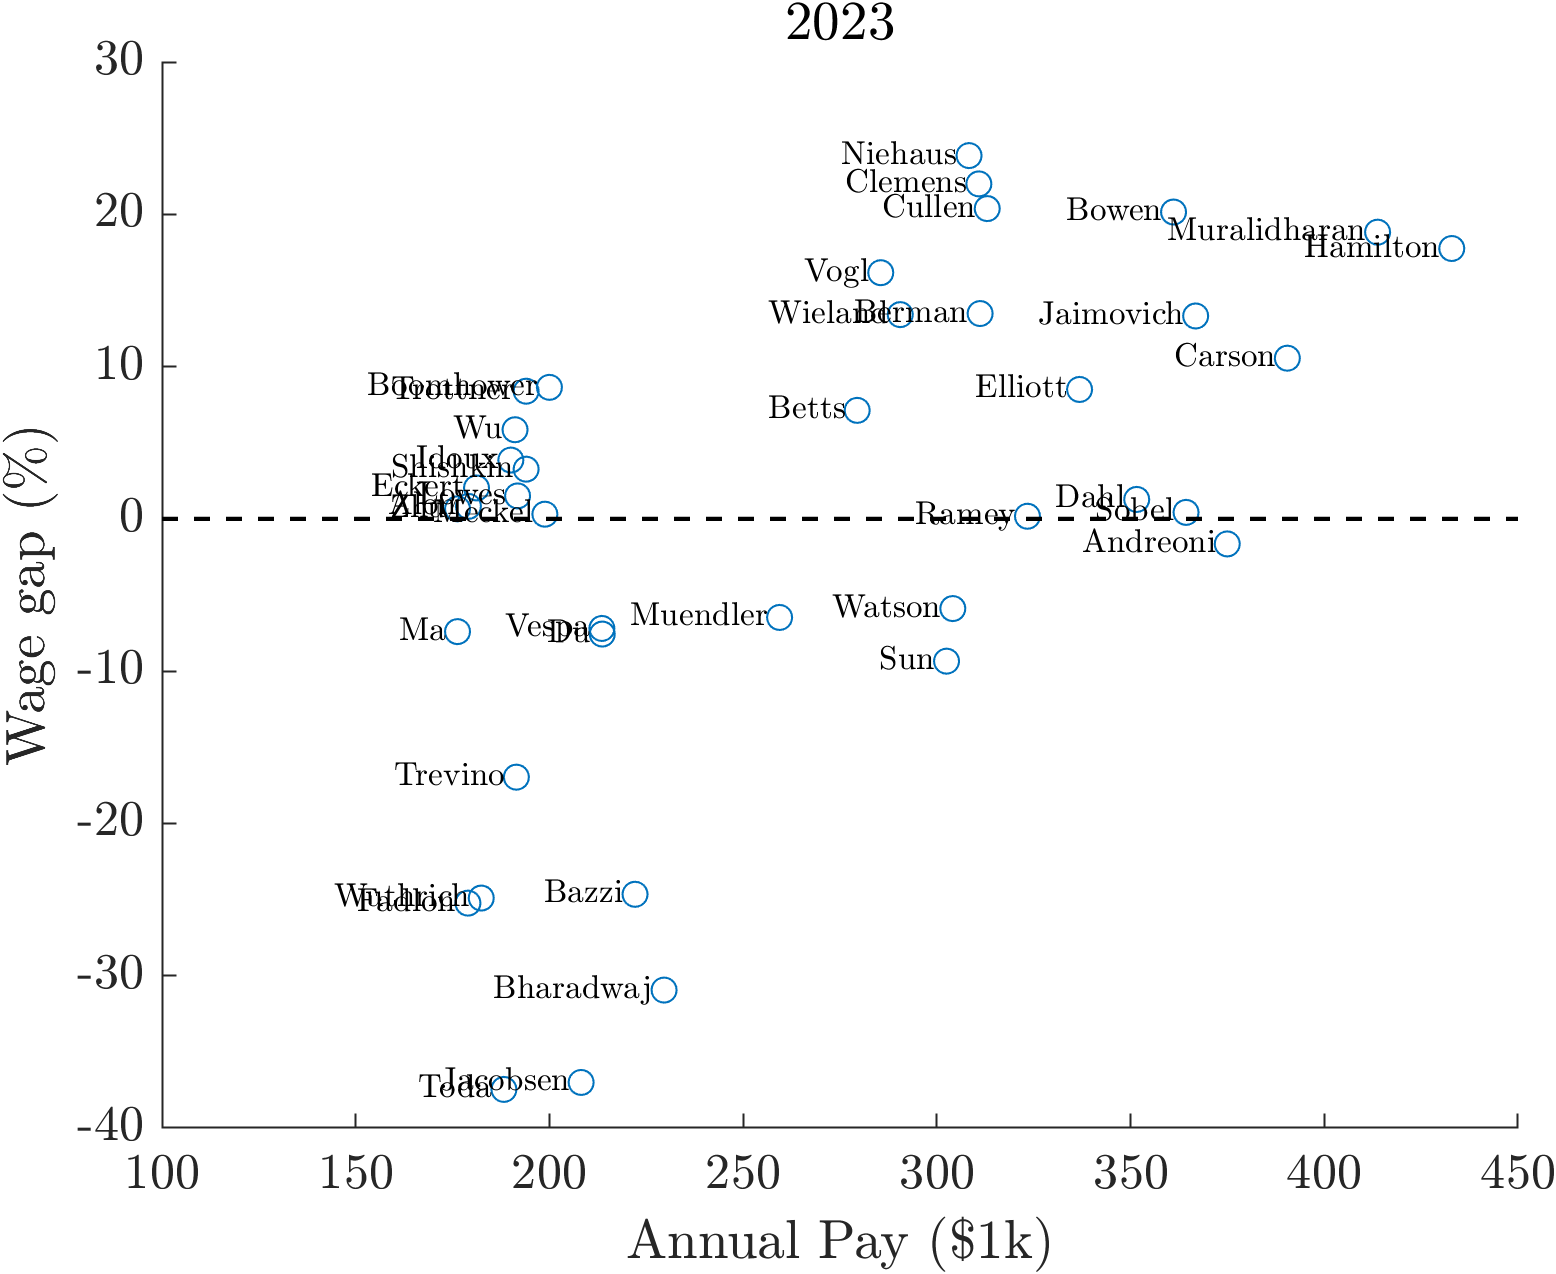
I updated the data and the scatter plot. In case readers are interested in predicting their salaries, the prediction equation in 2023 is \[\log y = 12.14 -0.0104T + 0.0053N_\textrm{pub} + 0.0206N_\textrm{top5} + 0.2269D_\textrm{assoc} + 0.4877D_\text{full}, \] where \(y\) is the 9-month salary, \(T\) is the number of years elapsed since obtaining Ph.D., \(N_\textrm{pub}\) is the cumulative number of peer-reviewed research articles, \(N_\textrm{top5}\) is the cumulative number of top 5 publications, and \(D_\textrm{assoc}, D_\textrm{full}\) are dummy variables for associate and full professors. (For clarity, the definitions of variables are slightly different from the paper but the regression is equivalent except omitting the quadratic term for \(T\), which is insignificant.) It would be cool to hire an RA to update the data annually and write a paper like “Income Inequality at UCSD, 2010-20XX” to document the evolution of income inequality as well as to estimate the separation probability as a function of the wage gap.