Capital and Labor Income Pareto Exponents across Time and Space
Published in Review of Income and Wealth, 2022
The 2009 review article of power laws by Gabaix states
The tail exponent of income seems to vary between 1.5 and 3 […]. There is less cross-country analysis on the exponent of the wealth distribution because the data are harder to find. It seems that the tail exponent of wealth is rather stable, perhaps around 1.5
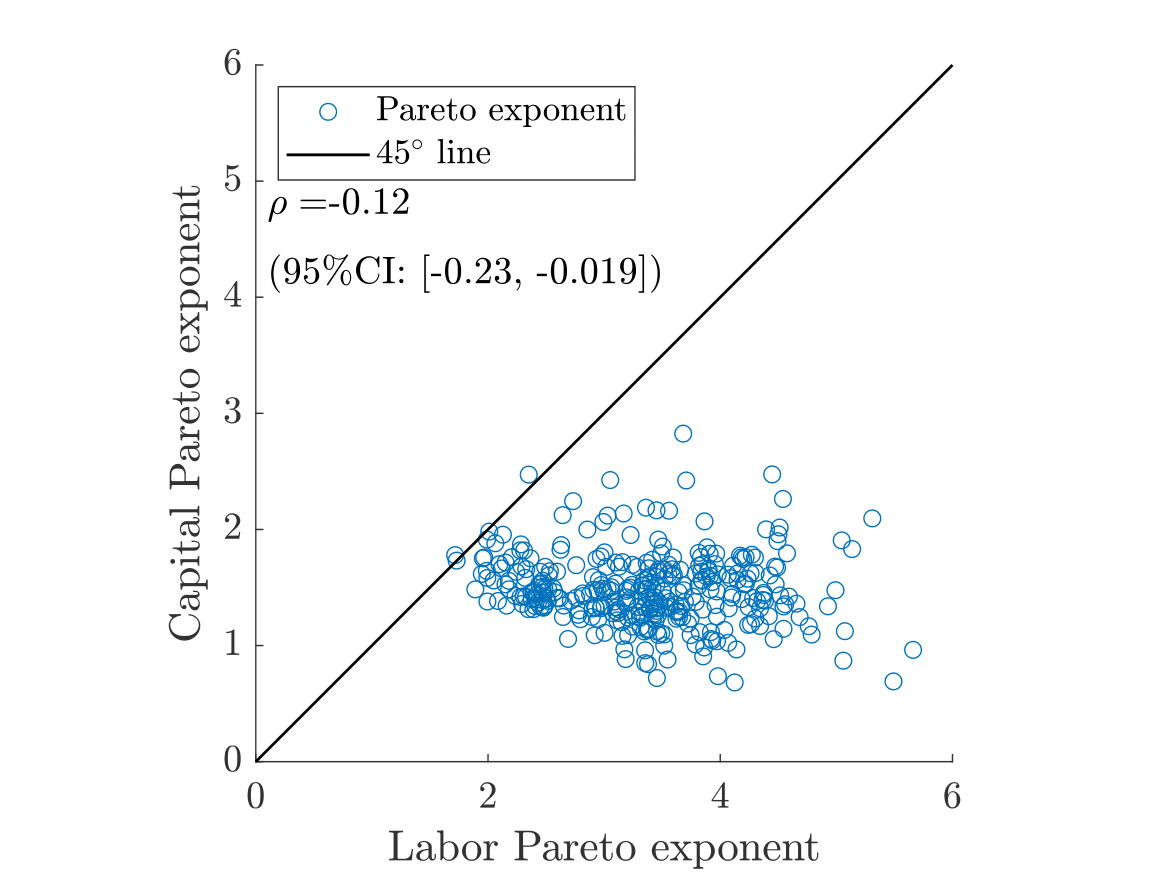
but does not cite exact references for these numbers. I looked at the sources Gabaix cites but felt the evidence weak, so I had been interested in conducting some more systematic study. In the summer of 2019, my student Tjeerd did GSR (graduate summer research, which means the department covers the cost of RAs) with me, and since he had a lot of programming experience, I asked him if he could use the Luxembourg Income Study Database to estimate capital and labor income Pareto exponents for all available countries and years. Tjeerd did a wonderful job, and in addition he found a way to test the equality of capital and labor income Pareto exponents, so we wrote a paper together. It turns out that capital income (hence wealth) inequality is higher than labor income inequality, with median Pareto exponents 1.46 and 3.35 respectively. As the scatter plot below shows, there is no relation between income and wealth inequality, so we need to distinguish the two.